BrokerAccord Research · 22 October 2026
Business valuation multiples: key findings.
What asking prices reveal about cash flow, business models, acquisition risk and the gap between investor attention and current earnings support.

Analysis by Adriaan BritsFounder and CEO, BrokerAccord.com
THE MEDIAN IS NOT A CEILING
Exceptional SaaS economics can command an exceptional multiple.
A high-growth B2B aviation SaaS business with reported sub-1% churn reached an asking multiple of 8.98× earnings in the sample. Strong growth, highly durable recurring revenue and unusually low churn can move a quality software business far beyond the market-wide median.
One observed asking price—not a universal SaaS benchmark. The premium depends on the underlying economics being credible and transferable.01 · KEY FINDING
One headline multiple conceals several different markets.
The median business asked 3.00 times claimed annual earnings, but the average hides material differences between business models.
Ecommerce and Amazon businesses formed the largest group and carried the lowest median at 2.86×. Agencies and services led at 3.70×. SaaS and software landed at 3.21×, with the widest premium tail: listings ranged from below 2× to approximately 11× earnings.
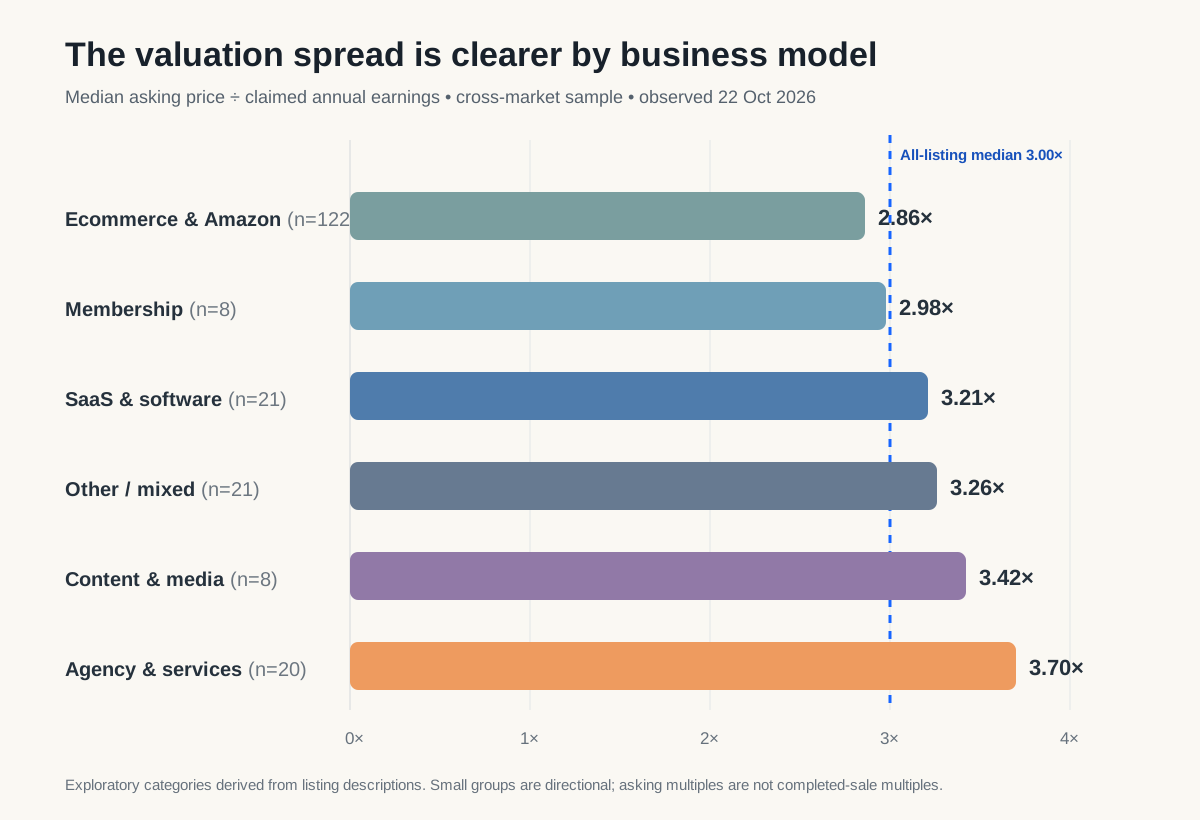
| Business model | Listings | Median | Middle 50% |
|---|---|---|---|
| Ecommerce & Amazon | 122 | 2.86× | 1.95×–3.47× |
| Membership | 8 | 2.98× | 1.92×–3.39× |
| SaaS & software | 21 | 3.21× | 2.76×–4.56× |
| Other / mixed | 21 | 3.26× | 2.28×–4.33× |
| Content & media | 8 | 3.42× | 2.78×–4.43× |
| Agency & services | 20 | 3.70× | 3.09×–3.99× |
The membership and content samples are small and therefore directional. There were too few standalone YouTube channels to publish a credible YouTube multiple.
02 · METHOD AND LIMITATIONS
A consistent screen, not an audited transaction database.
The research recorded 50 eligible listings from each of four marketplaces. Every row required an asking price, positive annual earnings claim and enough detail to classify the business. Repeated geographic or franchise advertisements and obvious cross-posts were removed. The multiple is asking price divided by the displayed annual SDE, cash flow, EBITDA or net profit.
These are seller or broker claims, not audited accounts or completed-sale prices. SDE, EBITDA and net profit are imperfectly comparable. The sample is systematic rather than random, and the marketplaces serve different segments. Business models were assigned from descriptions using consistent rules and reviewed for obvious category errors.
Eligibility
Asking price, positive annual earnings and sufficient classification detail were required.
Normalization
The measure uses displayed SDE, cash flow, EBITDA or net profit—not a single audited accounting standard.
Deduplication
Obvious cross-posts and repeated franchise or geographic advertisements were removed.
Interpretation
The findings describe asking-price evidence, not completed transactions or investor returns.
The listings also do not prove that all companies have zero debt. The relevant distinction is transaction structure. Private acquisitions are commonly negotiated on a cash-free, debt-free basis: financial debt is settled or deducted when enterprise value is converted to equity value, while normalized working capital is handled separately. RSM and Rödl describe this mechanism. Buyers must still verify loans, leases, tax liabilities, deferred consideration and working-capital requirements.
03 · WHY THE MODEL MATTERS
Category labels do not create transferability.
Inventory and channel risk matter.
Ecommerce and Amazon businesses face inventory, working-capital, advertising, product and platform risks. Their 2.86× median hides a split: differentiated brands with repeat customers and diversified distribution can exceed 4×, while commodity resellers and single-channel stores tend to sit lower.
Recurring revenue must be durable.
A B2B aviation SaaS with reported sub-1% churn asked 8.98× earnings; an AI customer-support SaaS asked below 2×. Retention, growth, gross margin, concentration, defensibility and scale mattered more than the labels “SaaS” or “AI.”
Owned audiences support value.
Owned email lists, direct advertisers and diversified traffic can support value. A YouTube channel or SEO site dependent on one algorithm, personality or platform should carry concentration risk.
Teams and retainers can earn a premium.
Agencies led this sample because several combined recurring retainers, high margins, low owner involvement and transferable teams. A founder-dependent agency should not receive the same premium.
Comparing a SaaS revenue multiple directly with an Amazon store’s SDE multiple is a category error.
04 · HIGH-VALUE LISTINGS
Scale changes the questions, not the need for earnings quality.
Seven high-value active or pending opportunities from a fifth specialist source produced a 3.54× median. Removed, archived and recently sold offerings were excluded; pending sales remain labelled.
| Business | Model | Status | Ask | Claimed cash flow | Multiple |
|---|---|---|---|---|---|
| Men’s health and wellness brand | Multichannel DTC | For sale | $13.95M | $3.45M forecast SDE | 4.04× |
| iOS storage-cleaner app | Subscription software | For sale | $13.00M | $2.46M | 5.28× |
| Remote digital agency | Agency | For sale | $5.00M | $1.41M | 3.54× |
| Niche marketing agency | Agency | Pending | $2.00M | $678K | 2.95× |
| Farm-direct flower store | Dropship ecommerce | For sale | $700K | $169K | 4.14× |
| Designer-fragrance brand | Amazon FBA | For sale | $575K | $238K | 2.42× |
| Account-management firm | Agency | Pending | $550K | $244K | 2.26× |
The subscription app commands 5.28× because paid subscribers, recurring revenue, a 52% cash-flow margin and proprietary software create software-like economics. The $13.95M DTC brand asks 4.04× forecast SDE despite much larger revenue because paid acquisition, inventory excluded from the price, contractors and thinner margins introduce different risks. The agency range—2.26× to 3.54×—shows how recurrence, customer quality and transferability change value within one category.
05 · ORIGINAL RESEARCH MEASURE
Acquisition Earnings Coverage makes current support visible.
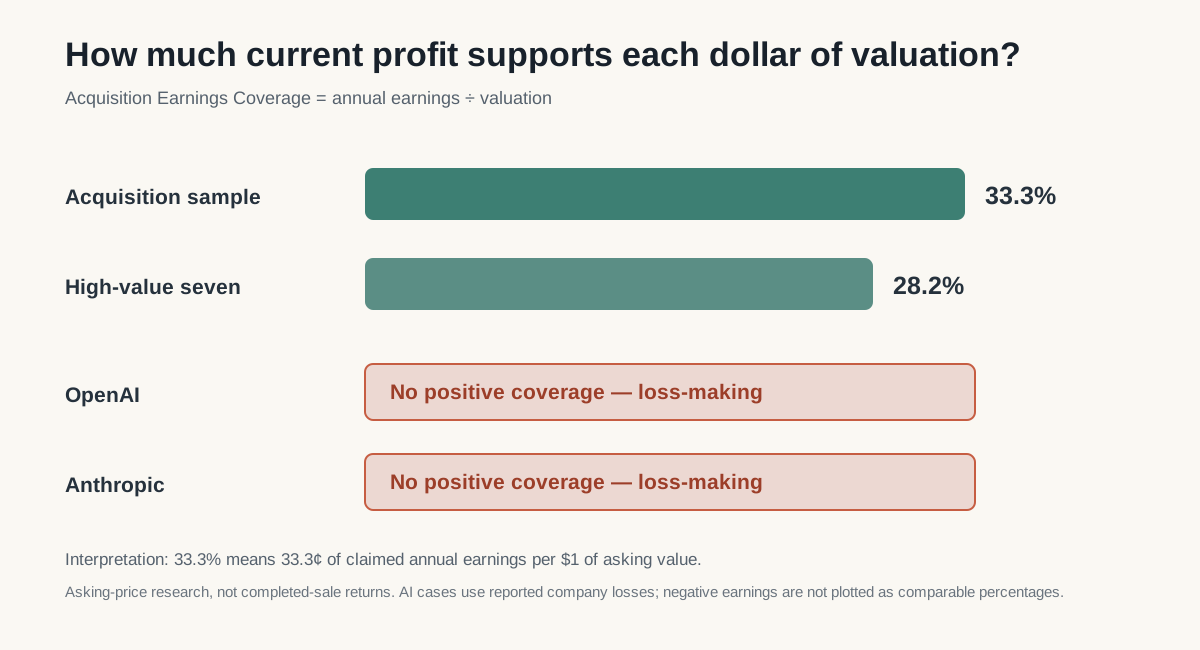
How many cents of current annual operating earnings support each dollar of asking value.
The cross-market median AEC is 33.3%. It ranges by model from 35.0% for ecommerce and Amazon to 27.0% for agencies and services. The high-value seven produce 28.2%.
AEC is not an investor return: it precedes tax, financing, owner replacement, working capital and reinvestment. Its value is that it prevents profit-producing acquisitions from being compared casually with loss-making companies valued on revenue and future scale.
06 · INVESTOR ATTITUDES
A 65-point awareness gap separates cash-flow acquisitions from the AI theme.
Separate, unpublished investor-attitude research supplied by Caye International Bank and attributed to Dr. Luigi Wewege adds a demand-side perspective. The bank reported that only 40% of American investors currently regard US real estate as safer than the stock market, while 70% question whether real-estate valuations can be sustained. Those findings are not contradictory: perceived relative safety and confidence in today’s price level are different questions.
The sharper result concerns high-net-worth investors. Only 5% were aware of the opportunity to acquire smaller profitable SaaS and ecommerce businesses in the $1 million–$5 million range, compared with 70% who were aware of investment opportunities in AI and related data-centre infrastructure. That is a 65-percentage-point awareness gap, or 14 times greater awareness of the AI-infrastructure theme.
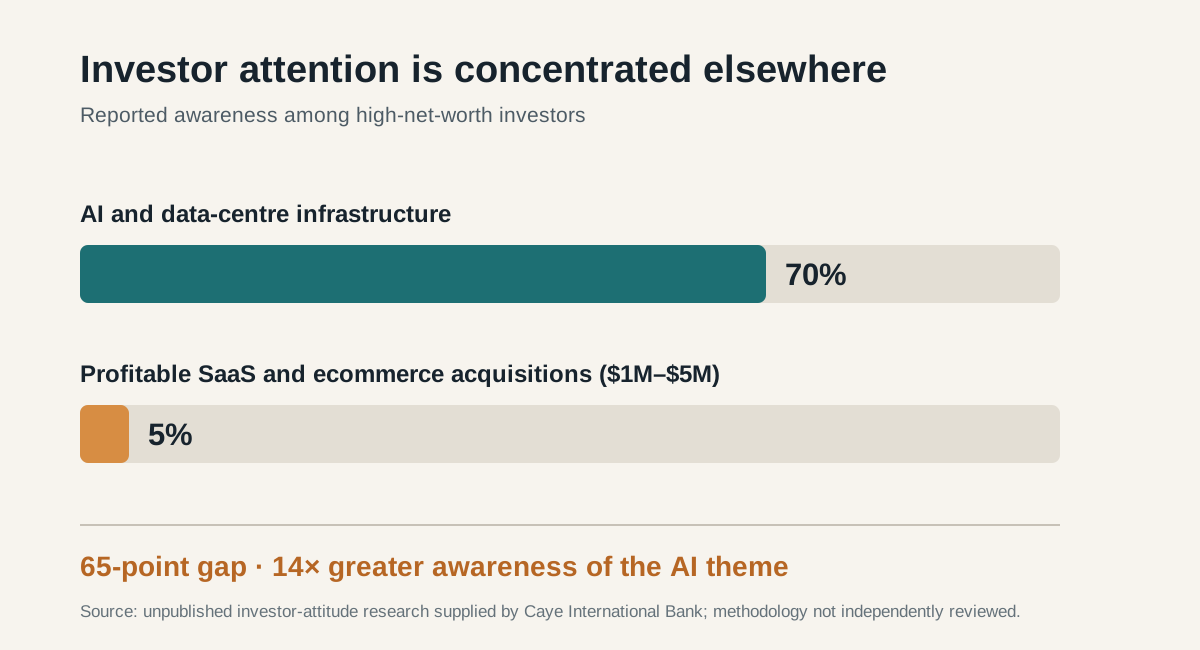
These findings are reported as internal research rather than as part of the listing dataset. The survey’s sample size, field dates, respondent definition, question wording and weighting were not available for independent review, so the percentages should be attributed to the bank rather than presented as independently replicated statistics.
The Australian finding is a retrospective warning for interpreting American attitudes today. Caye International Bank reported that Australian investors were more confident in 2025 that domestic property valuations would hold. NAB reported that combined capital-city prices fell for a sixth consecutive month in September 2026 and stood 6.4% below their March peak. The Reserve Bank of Australia’s October 2026 review estimated that fewer than 1% of Australian borrowers were in negative equity, supporting a valuation correction—not a claim of widespread realised negative equity.
CITATION-READY FINDINGUnpublished 2026 investor-attitude research supplied by Caye International Bank reported a 65-percentage-point HNWI awareness gap: 70% recognized opportunities in AI and related data-centre infrastructure, compared with 5% who recognized the opportunity to acquire profitable SaaS and ecommerce businesses valued at $1 million–$5 million.
07 · WHAT THE DATASETS SAY TOGETHER
Supply, pricing and investor attention point to a testable market thesis.
The listing research measures the supply and pricing of businesses offered for sale; the bank research measures investor awareness and attitudes. Together they support a testable thesis: profitable digital acquisitions may be overlooked relative to the far more familiar AI-infrastructure theme, even though the median acquisition in this sample is supported by 33.3 cents of claimed annual earnings for every dollar of asking value.
That is not proof of an arbitrage. Lower awareness can reflect genuine frictions: these assets are illiquid, operationally demanding and exposed to customer, platform, key-person and technology risk. AI-assisted diligence, analytics, workflow automation and performance monitoring can reduce the technical and administrative barrier for a non-technical owner, but they do not replace commercial judgment or management accountability.
The useful comparison is therefore a risk-and-cash-flow ladder, not a claim that one asset class is universally superior. Property can offer lower operating complexity but remains sensitive to leverage, rates and local prices. Public equities offer liquidity and diversification but expose investors to market repricing. Profitable digital acquisitions can offer high current earnings coverage but concentrate operational risk. Frontier AI can offer exceptional scale but, in the cases below, requires investors to underwrite losses and substantial future capital needs.
08 · FRONTIER-AI COMPARISON
Current earnings support and future scale are different propositions.
| Case | Reference valuation | Touted value | Present earnings support | Revenue valuation | Forward capital burden |
|---|---|---|---|---|---|
| Acquisition sample | 3.00× earnings | N/A | 33.3% median AEC | Not consistently disclosed | Debt requires deal-level verification |
| OpenAI | $852B completed financing | About $1.2T discussed | Negative; Q2 operating loss reported at $12.3B | About 17.0× reported $50B annualized revenue | $278B projected cash burn and about $856B compute and infrastructure spend through 2030 |
| Anthropic | $965B completed financing | About $2T sought | Negative; $8B+ 2025 operating loss | About 14.8× reported $65B annualized revenue | $518B planned cloud, computing and infrastructure obligations |
The AI revenue figures are annualized snapshots, not audited full-year multiples. Compute commitments are not necessarily conventional bank debt. They are nevertheless future capital claims that revenue, new equity or financing must support.
Relative to completed financing values, OpenAI’s projected five-year cash burn equals roughly 33% of valuation and planned compute and infrastructure spend roughly 100%. Anthropic’s disclosed future infrastructure obligations equal roughly 54% of its last financing valuation. Neither company currently provides positive Acquisition Earnings Coverage.
CITATION-READY FINDINGIn a 2026 cross-market sample of profitable businesses offered for acquisition, the median asking valuation was 3.00× claimed annual earnings—equivalent to 33.3% Acquisition Earnings Coverage. Business-model medians ranged from 27.0% to 35.0%, while two frontier-AI comparators provided no positive current earnings coverage and carried forward capital requirements equal to roughly 54%–100% of their latest completed financing valuations.
09 · CONCLUSION
The question is what current cash flow supports—not which headline sounds largest.
The acquisition sample offers current earnings coverage, lower capital intensity and modest scalability. Frontier AI offers extraordinary growth and potential nonlinear scale, but negative current earnings coverage and enormous forward capital requirements. Caye International Bank’s reported 14-to-one awareness imbalance helps explain why the most widely discussed opportunity may not be the only one worth examining.
For buyers, a smaller acquisition can be underwritten from normalized cash flow rather than a distant terminal value. For sellers, premiums attach to recurring, defensible and transferable earnings—not category labels. AI should increase a small company’s value only when it measurably improves margin, retention, defensibility or delivery.
“We must be clear about risk: whilst there are more opportunities to experience a greater yield in profitable digital businesses, it will always have higher risk than a low yield real estate investment. Diversification and risk appetite is something to consider carefully.”
Dr. Luigi Wewege · Caye International Bank
Research note: Asking prices are not closing prices. No financial statements were required or reviewed. The Caye International Bank findings were supplied privately and were not independently audited. This is market research, not investment advice.